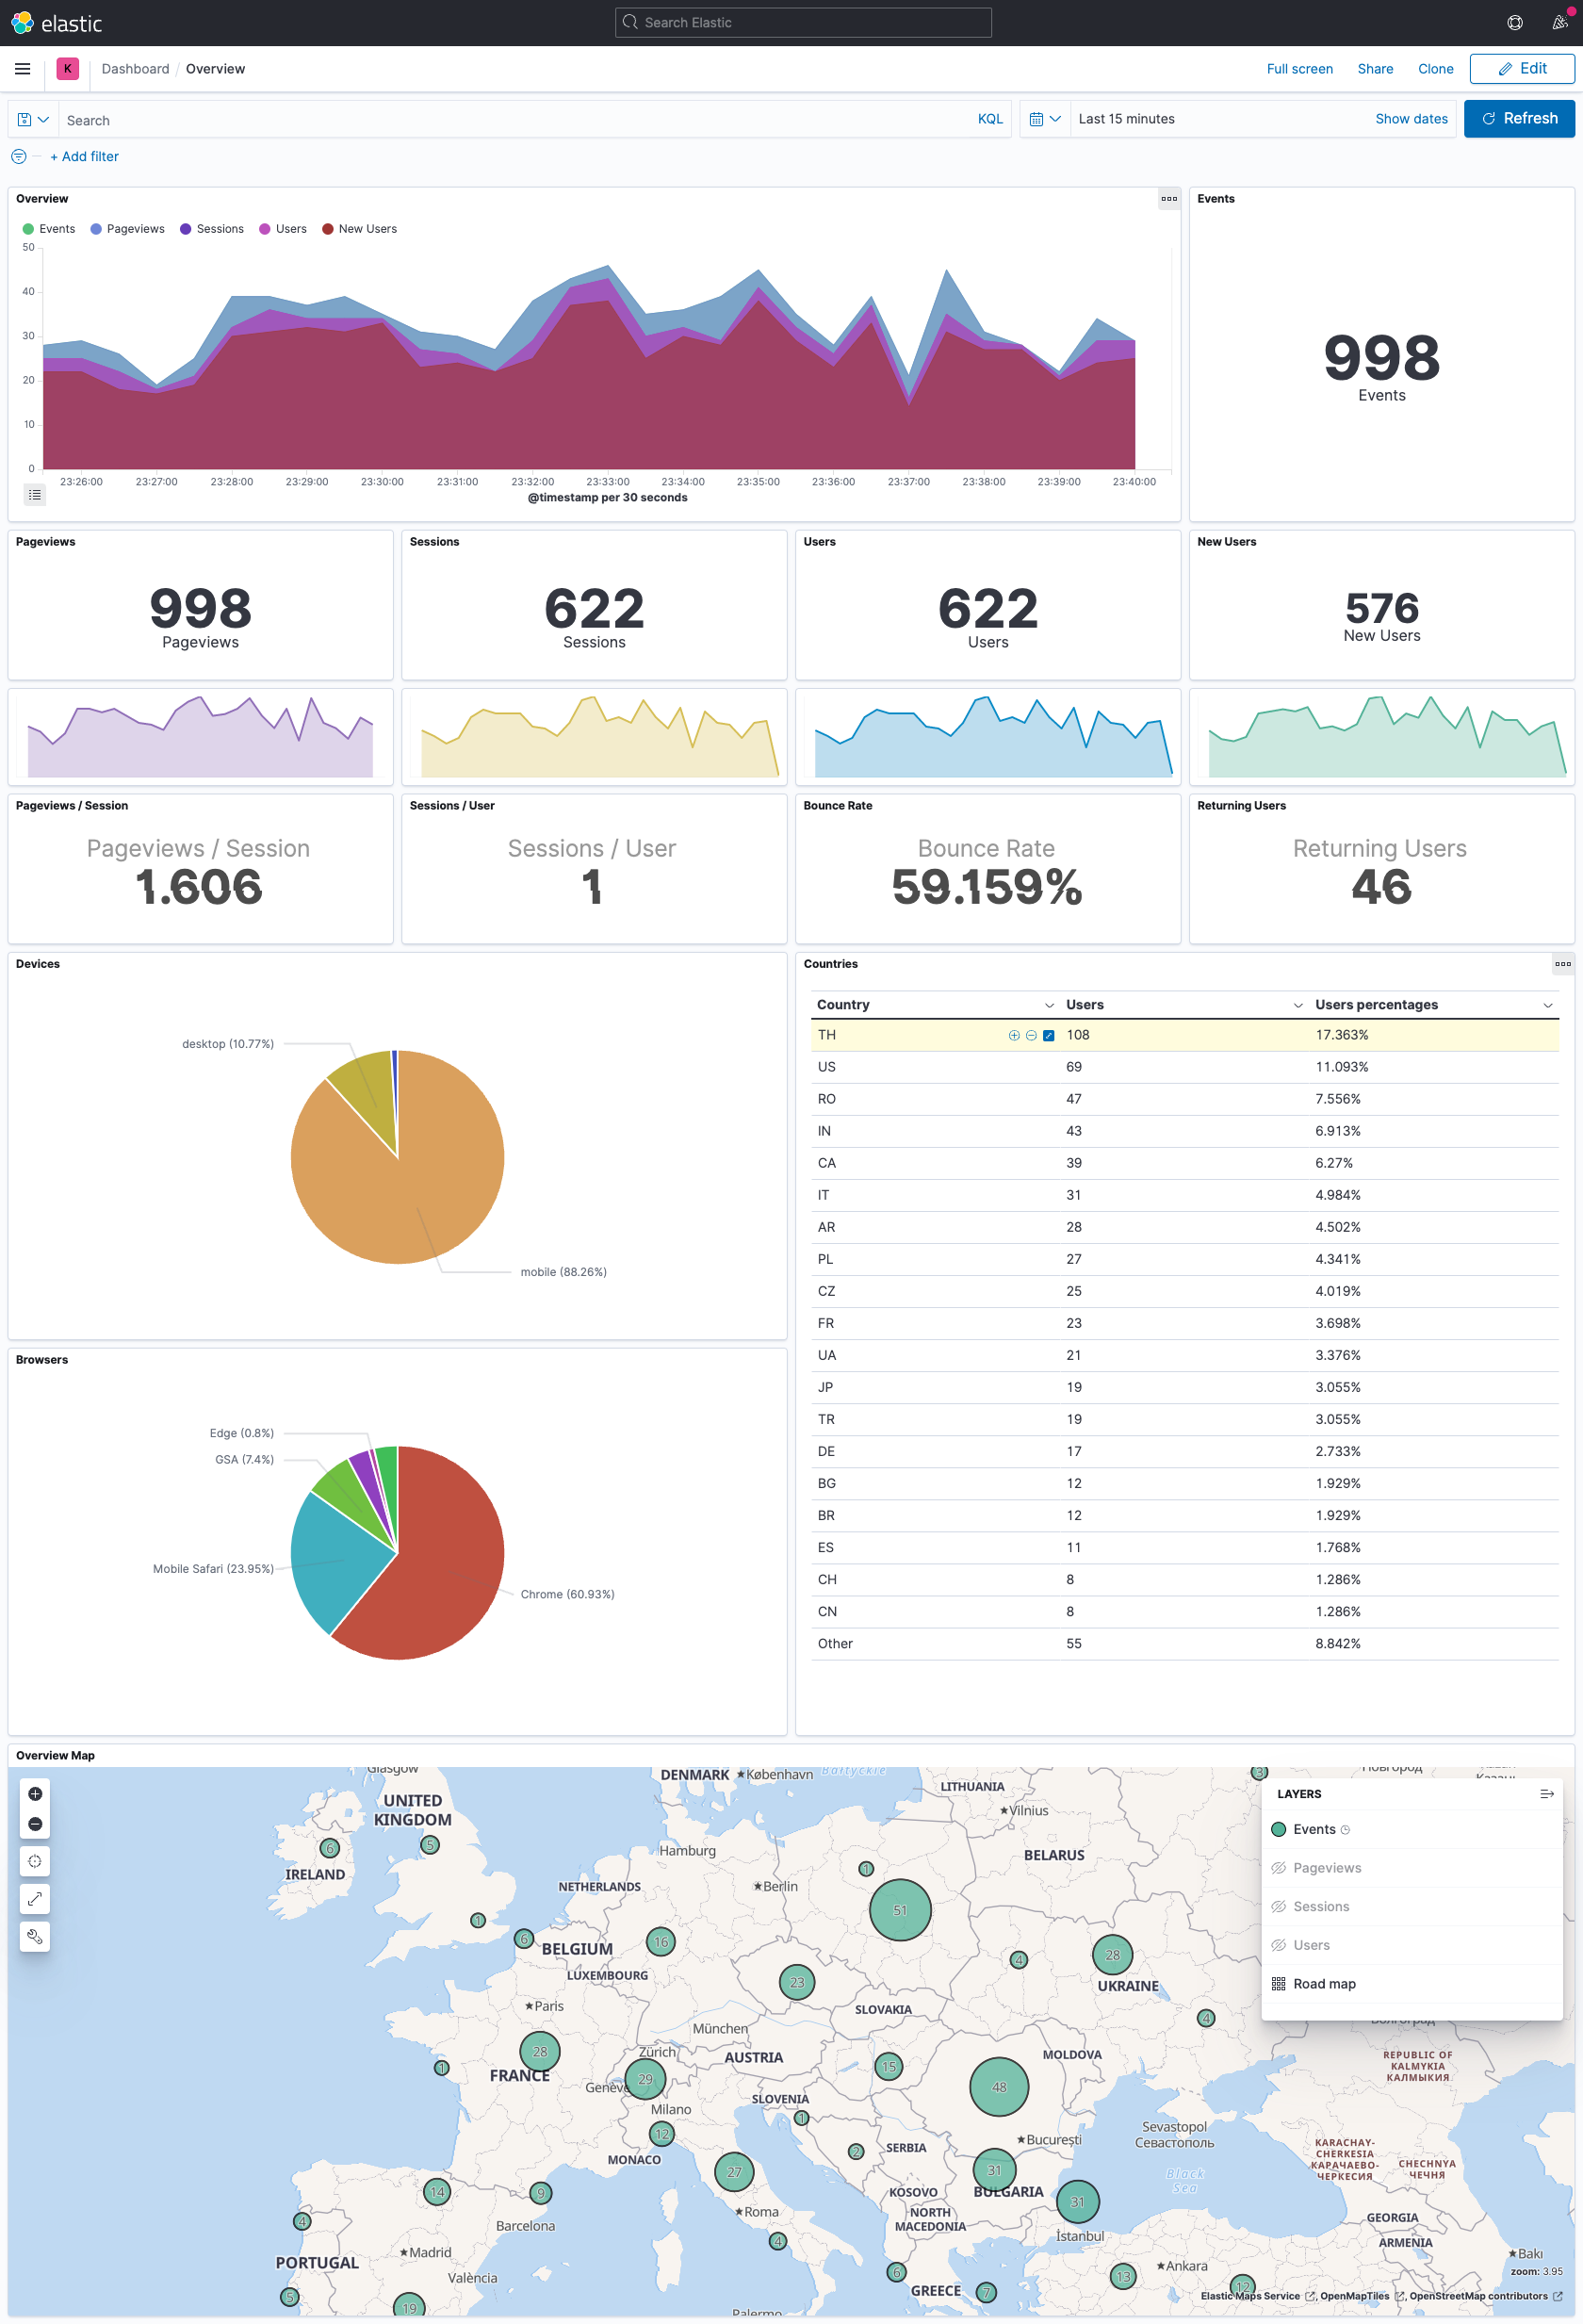
Dashboard
Kibanalytics has a default dashboard for viewing the collected data.
To load the default dashboard, remember to run the following command after the first start of all Kibanalytics services.
docker-compose run node npm run load-dashboards
WARNING
Kibana index needs at last one entry in database to dynamic load properties, so before open the dashboard, ensure to have at last one dispatched event from Kibanalytis, otherwise the dashboard will show multiple errors.
The dashboard can be fully customized within the Kibana interface and also serves as a template for new dashboards. There are many ways to aggregate data, and each project has specific needs and metrics, feel free to modify it and add your own metrics.
To learn more about Kibana tool and how to use it to customize the dashboard, it is recommended to read the oficial Kibana guide.
Below are the default dashboard metrics, a brief description, how they were calculated and the Elasticsearch query example.
Events Metric
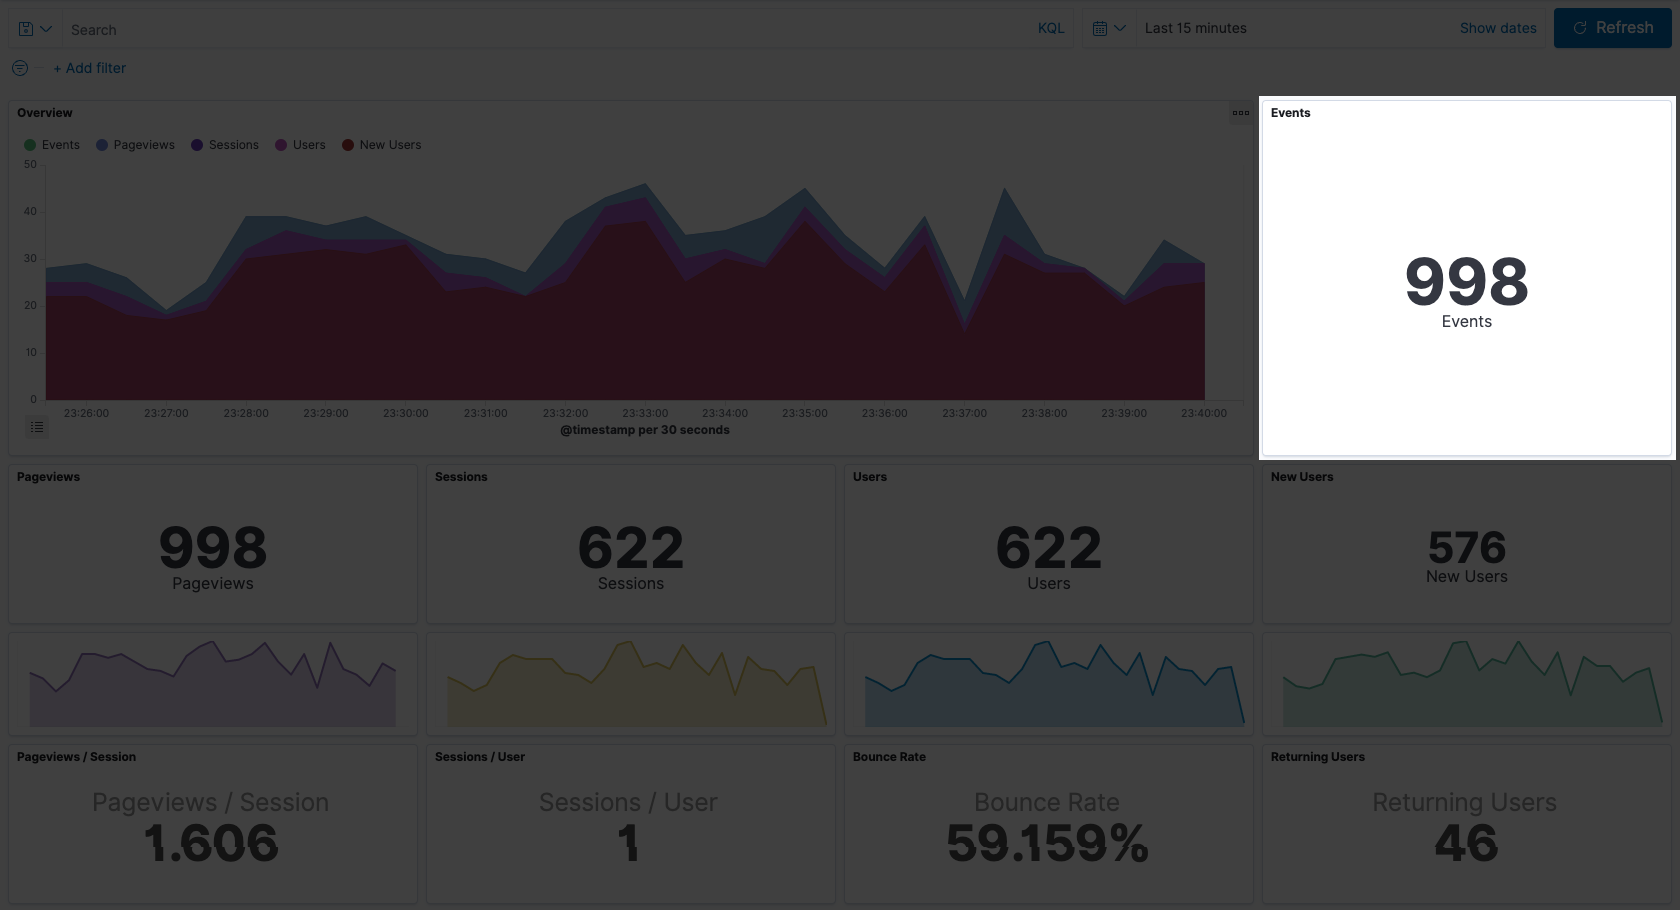
Events dispatched by the tracker client lib. The events metric is calculated by couting the total number of calls to the server collect API in a time range.
{
  "aggs": {},
  "size": 0,
  "fields": [
    {
      "field": "@timestamp",
      "format": "date_time"
    }
  ],
  "script_fields": {},
  "stored_fields": [
    "*"
  ],
  "_source": {
    "excludes": []
  },
  "query": {
    "bool": {
      "must": [],
      "filter": [
        {
          "match_all": {}
        },
        {
          "range": {
            "@timestamp": {
              "gte": "2022-05-03T17:18:02.580Z",
              "lte": "2022-05-03T17:33:02.580Z",
              "format": "strict_date_optional_time"
            }
          }
        }
      ],
      "should": [],
      "must_not": []
    }
  }
}
Pageviews Metric
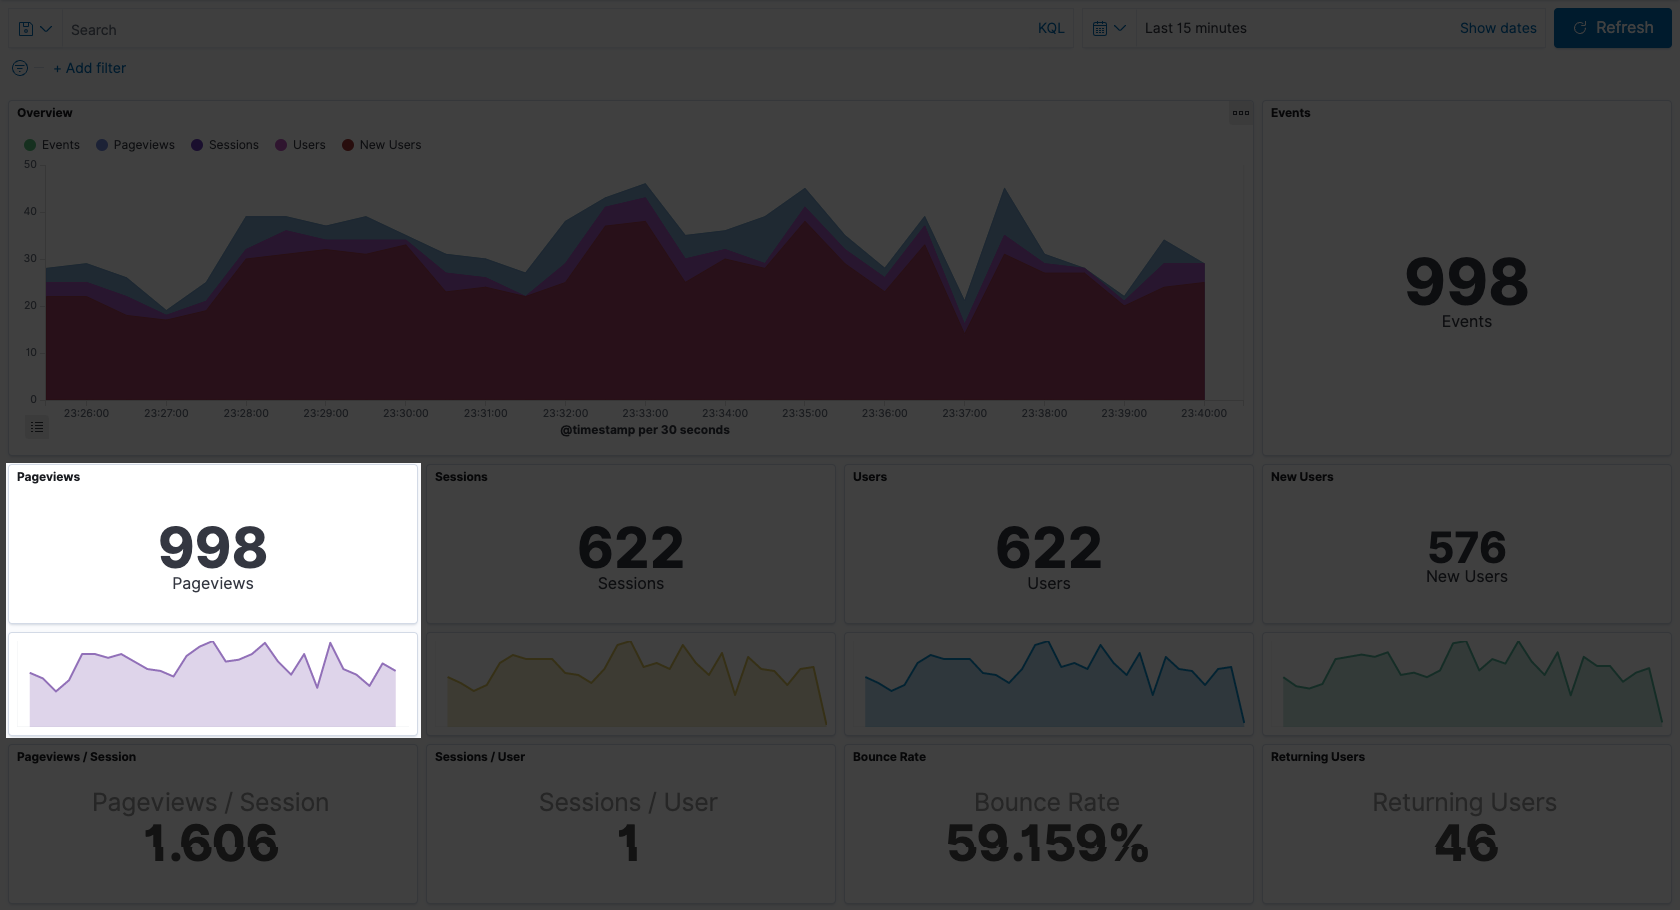
The pageviews metric is calculated by counting the total number of events filtered by event type "pageview" in a time range.
{
  "aggs": {},
  "size": 0,
  "fields": [
    {
      "field": "@timestamp",
      "format": "date_time"
    }
  ],
  "script_fields": {},
  "stored_fields": [
    "*"
  ],
  "_source": {
    "excludes": []
  },
  "query": {
    "bool": {
      "must": [],
      "filter": [
        {
          "bool": {
            "should": [
              {
                "match_phrase": {
                  "event.type": "pageview"
                }
              }
            ],
            "minimum_should_match": 1
          }
        },
        {
          "range": {
            "@timestamp": {
              "gte": "2022-05-03T17:18:38.475Z",
              "lte": "2022-05-03T17:33:38.475Z",
              "format": "strict_date_optional_time"
            }
          }
        }
      ],
      "should": [],
      "must_not": []
    }
  }
}
Sessions Metric
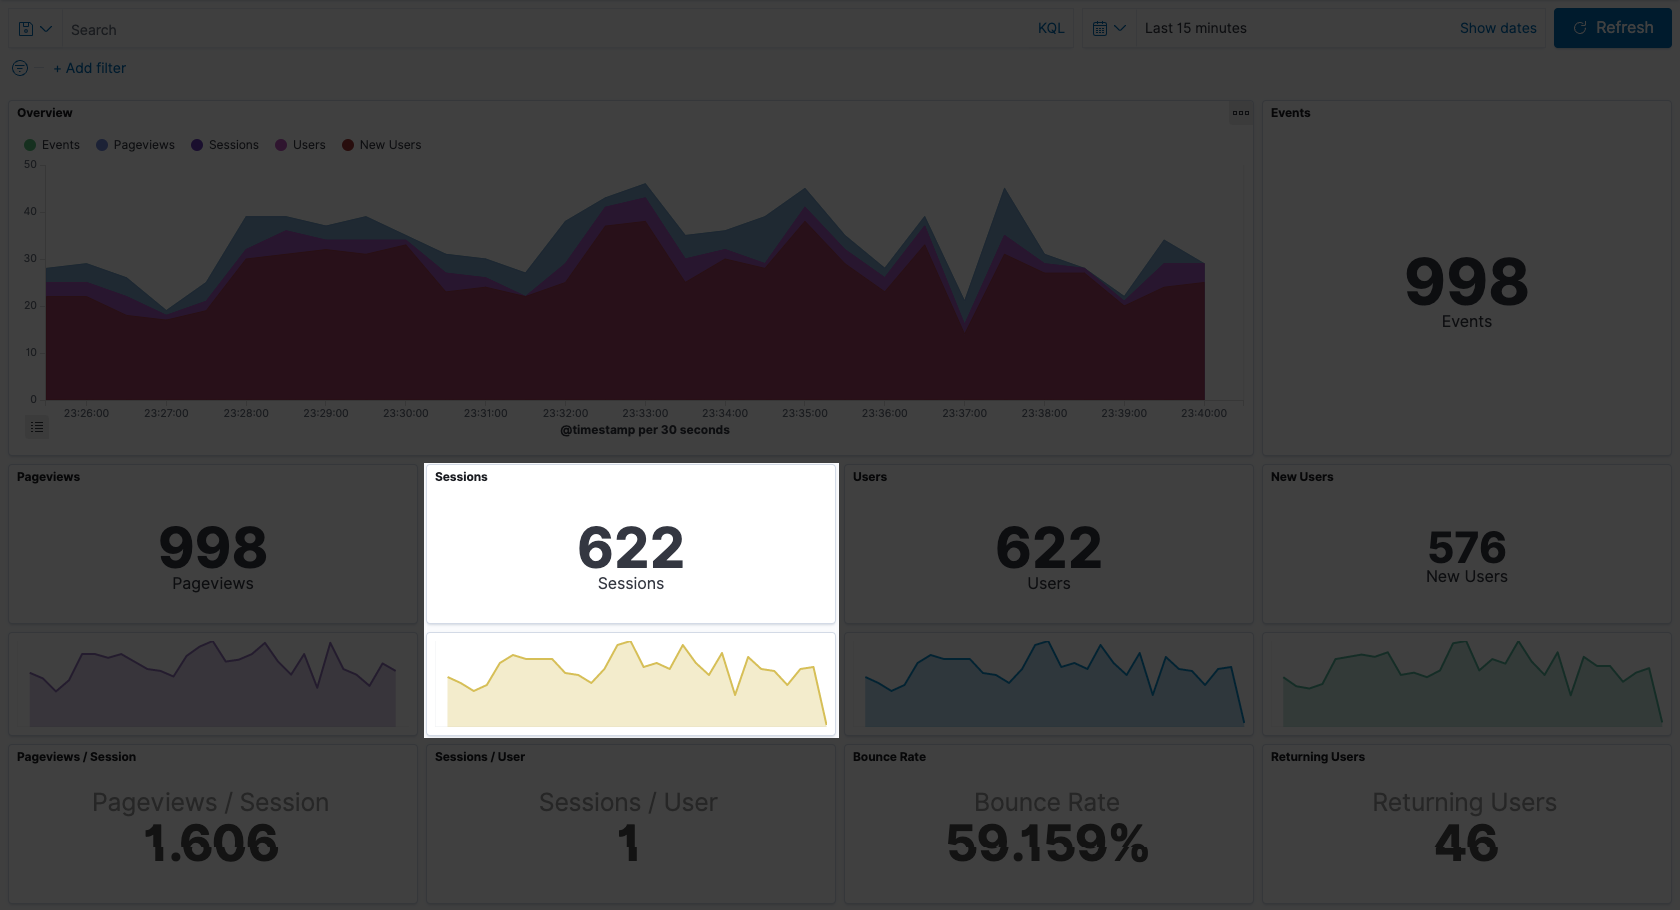
The sessions metric is calculated by counting the total number of unique session _ids in a time range.
{
  "aggs": {
    "1": {
      "cardinality": {
        "field": "session._id.keyword"
      }
    }
  },
  "size": 0,
  "fields": [
    {
      "field": "@timestamp",
      "format": "date_time"
    }
  ],
  "script_fields": {},
  "stored_fields": [
    "*"
  ],
  "_source": {
    "excludes": []
  },
  "query": {
    "bool": {
      "must": [],
      "filter": [
        {
          "match_all": {}
        },
        {
          "range": {
            "@timestamp": {
              "gte": "2022-05-03T17:16:23.898Z",
              "lte": "2022-05-03T17:31:23.898Z",
              "format": "strict_date_optional_time"
            }
          }
        }
      ],
      "should": [],
      "must_not": []
    }
  }
}
Users Metric
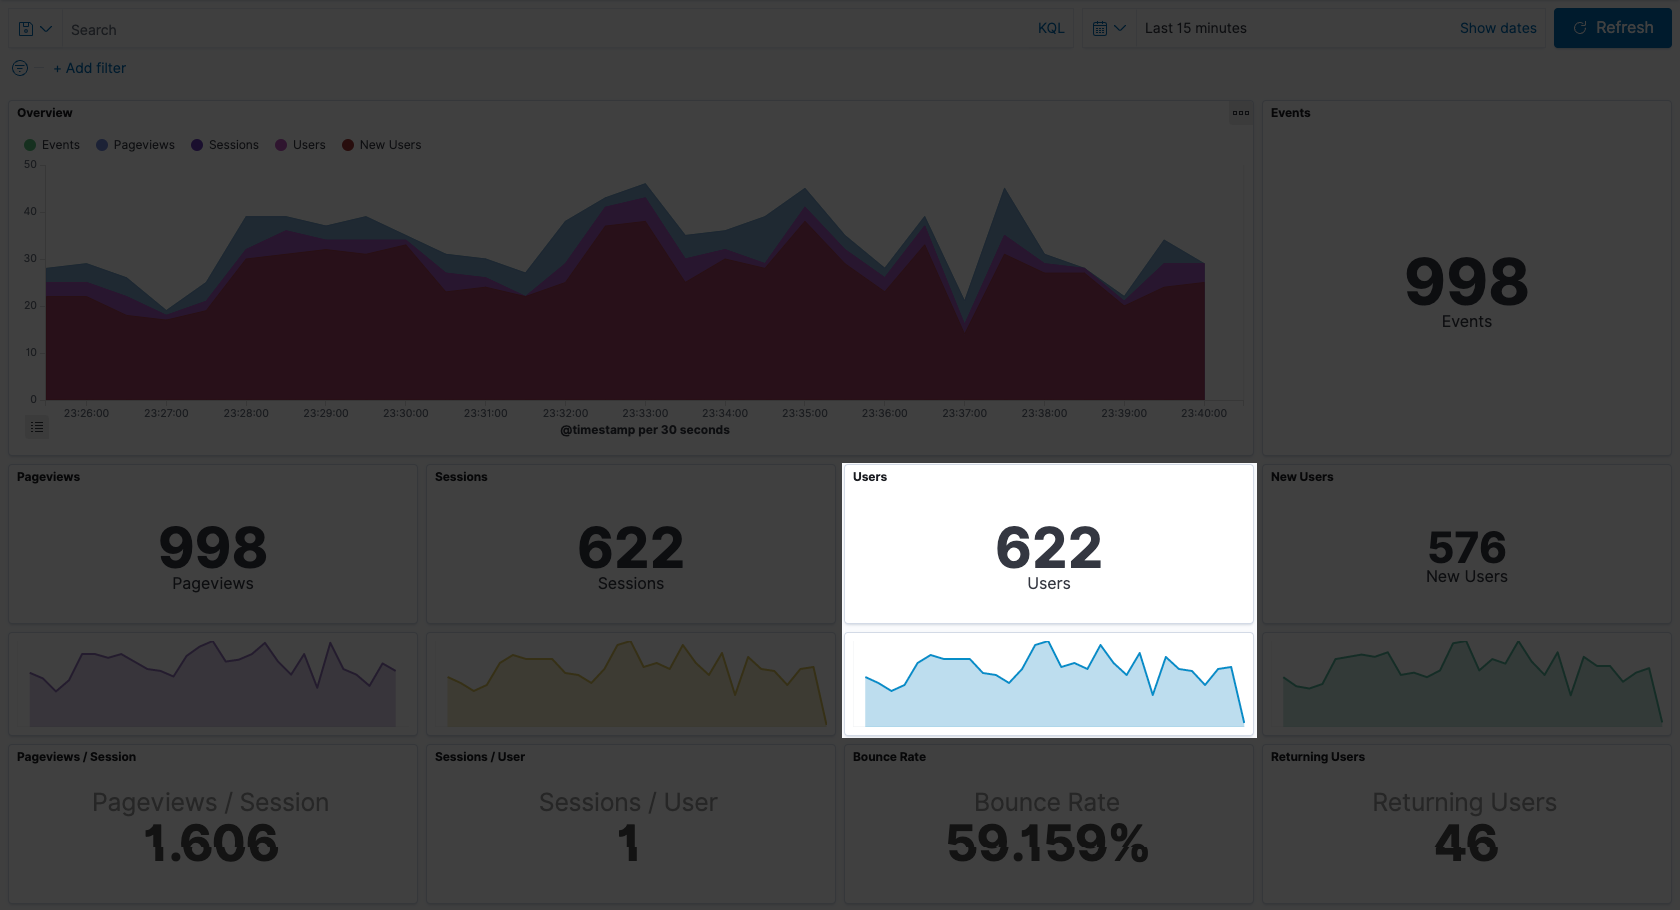
The users metric is calculated by counting the total number of unique user _ids in a time range.
{
  "aggs": {
    "1": {
      "cardinality": {
        "field": "user._id.keyword"
      }
    }
  },
  "size": 0,
  "fields": [
    {
      "field": "@timestamp",
      "format": "date_time"
    }
  ],
  "script_fields": {},
  "stored_fields": [
    "*"
  ],
  "_source": {
    "excludes": []
  },
  "query": {
    "bool": {
      "must": [],
      "filter": [
        {
          "match_all": {}
        },
        {
          "range": {
            "@timestamp": {
              "gte": "2022-05-03T17:19:46.716Z",
              "lte": "2022-05-03T17:34:46.716Z",
              "format": "strict_date_optional_time"
            }
          }
        }
      ],
      "should": [],
      "must_not": []
    }
  }
}
New Users Metric
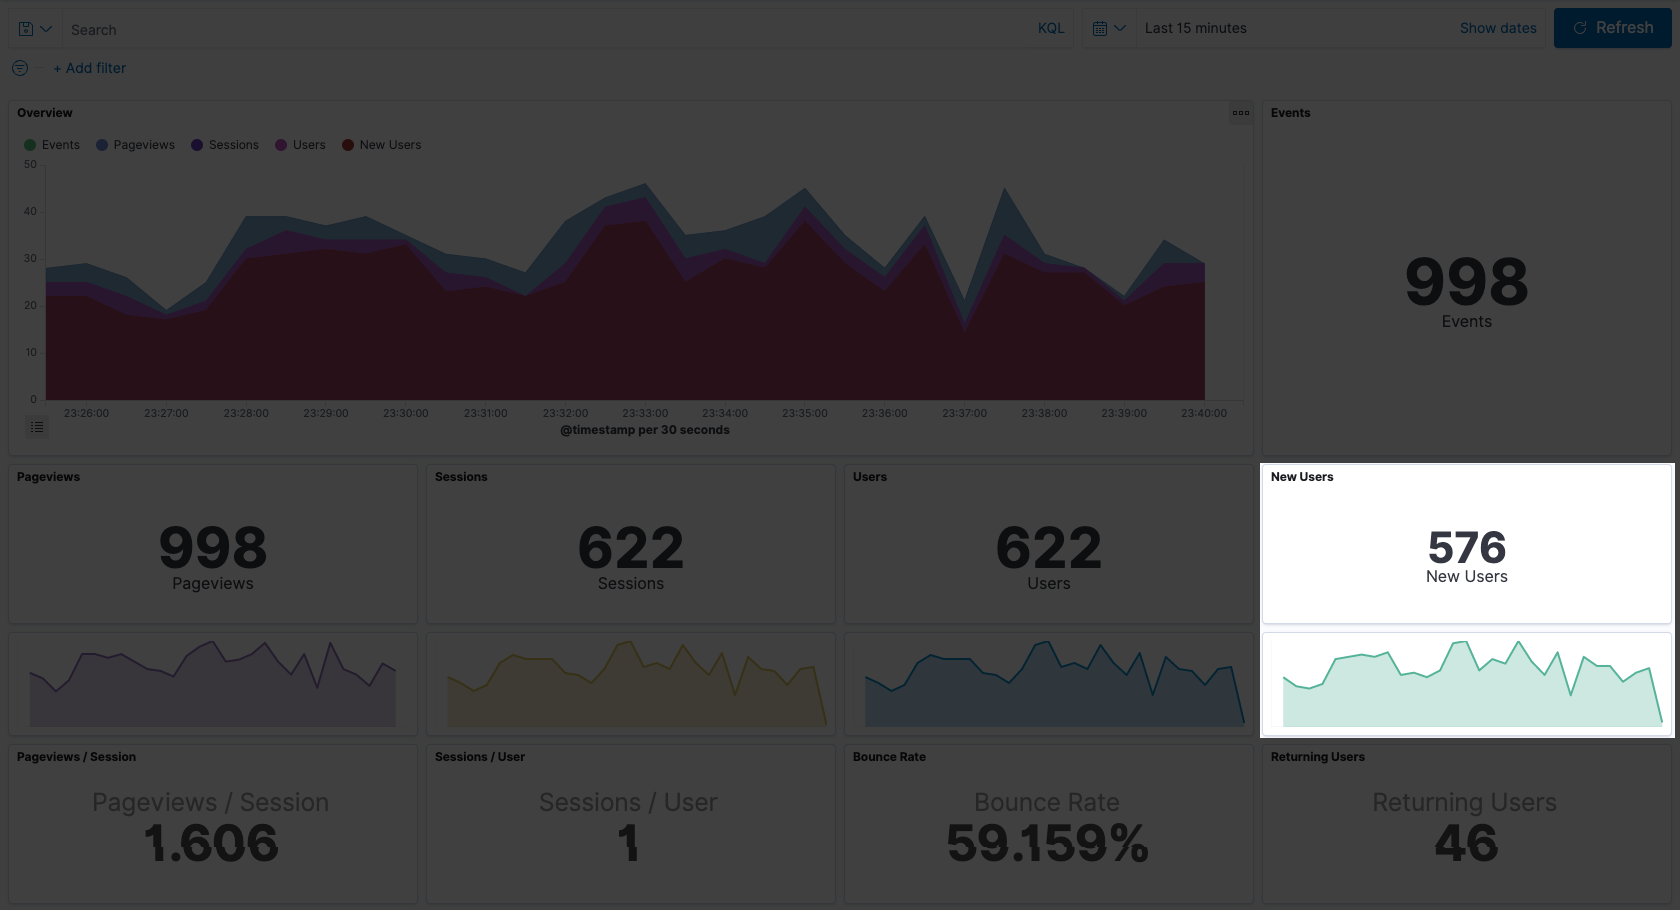
The new users metric is calculated by counting the total number of unique user _ids in a time range filtered by "user.new" equals to true.
{
  "aggs": {
    "1": {
      "cardinality": {
        "field": "user._id.keyword"
      }
    }
  },
  "size": 0,
  "fields": [
    {
      "field": "@timestamp",
      "format": "date_time"
    }
  ],
  "script_fields": {},
  "stored_fields": [
    "*"
  ],
  "_source": {
    "excludes": []
  },
  "query": {
    "bool": {
      "must": [],
      "filter": [
        {
          "bool": {
            "should": [
              {
                "match": {
                  "user.new": true
                }
              }
            ],
            "minimum_should_match": 1
          }
        },
        {
          "range": {
            "@timestamp": {
              "gte": "2022-05-03T18:06:56.955Z",
              "lte": "2022-05-03T18:21:56.955Z",
              "format": "strict_date_optional_time"
            }
          }
        }
      ],
      "should": [],
      "must_not": []
    }
  }
}
Overview Area Chart
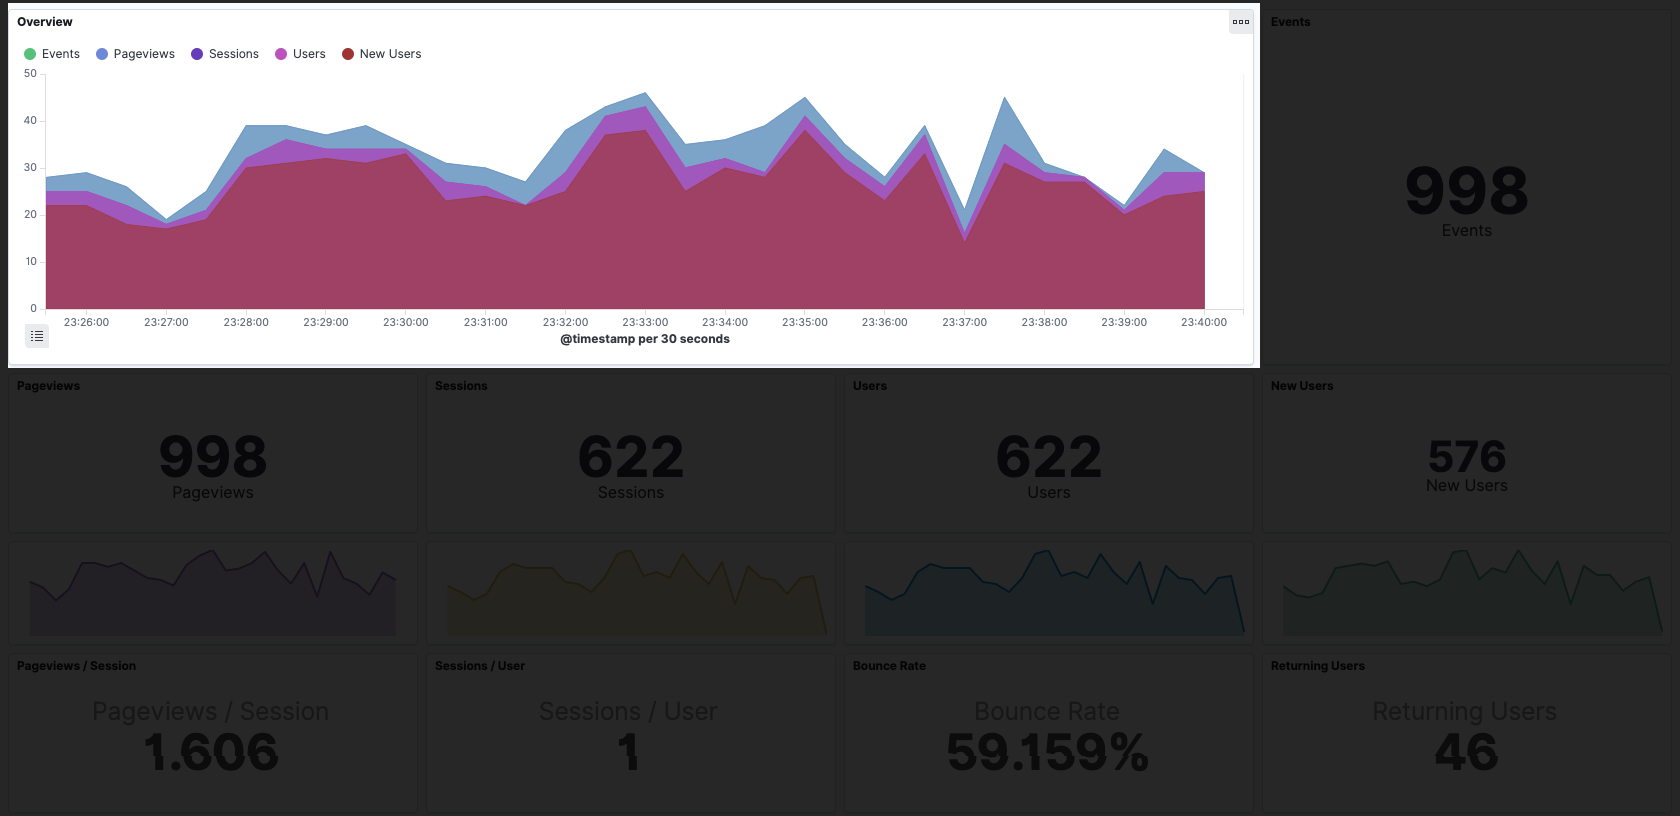
The overview area chart have values calculated by the same metrics mentioned before (events, pageviews, sessions, users and new users) in a time range.
Pageviews / Session Metric
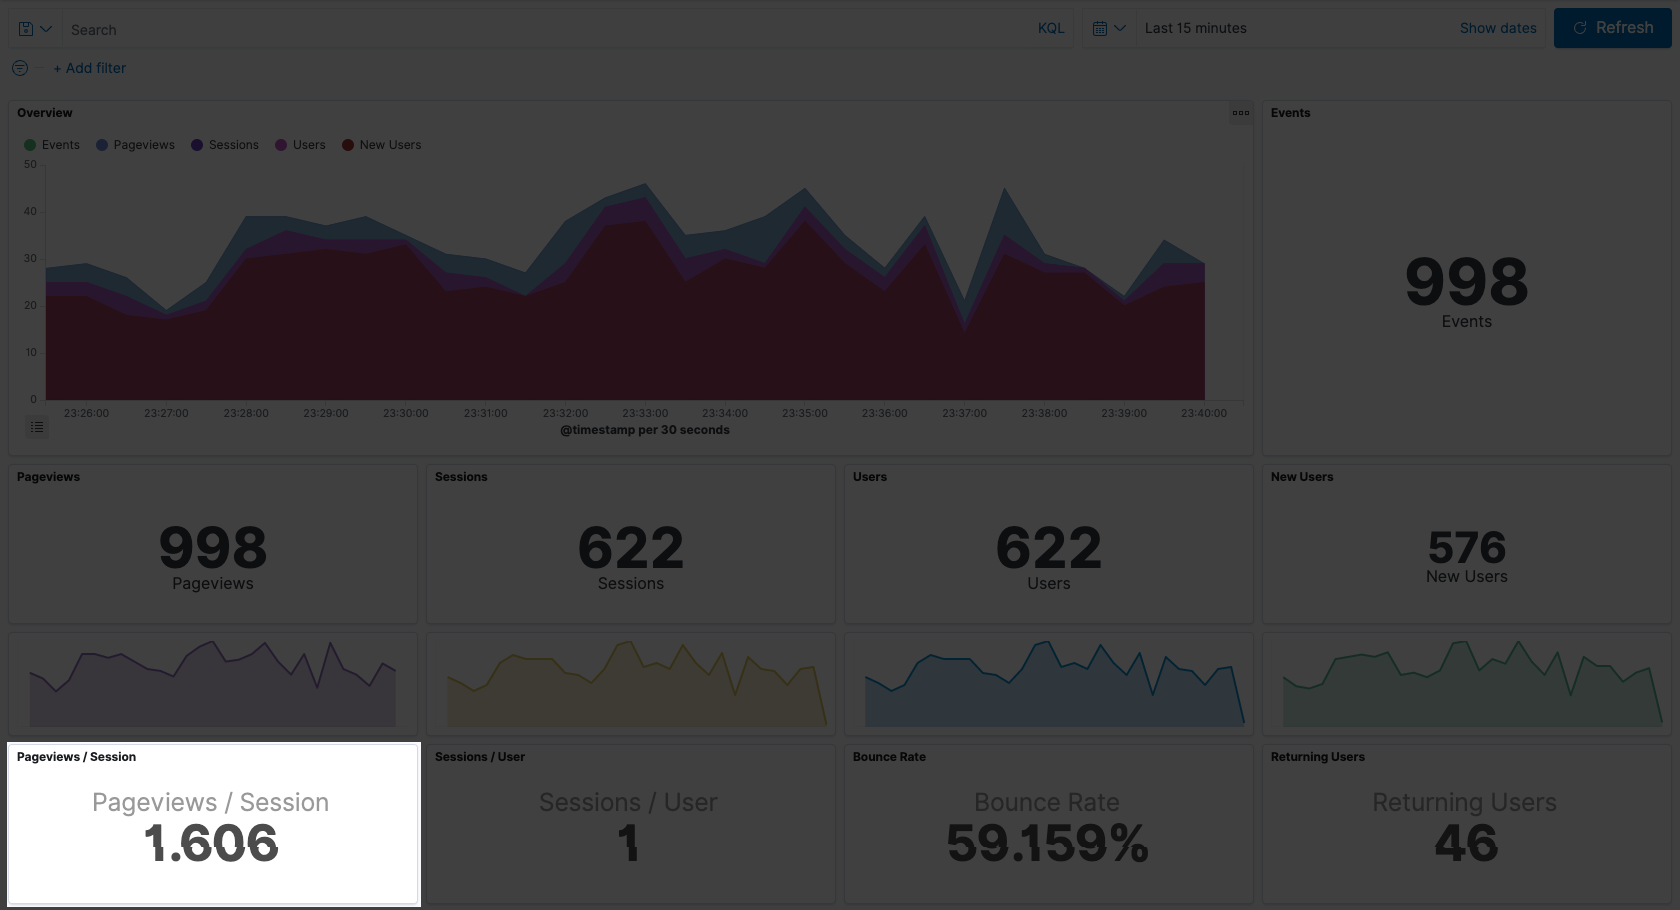
Pageviews / Session metric is the relation between pageviews and sessions in a time range.
This metric uses Kibana TSVB visualization so query inspection is not supported. Check que visualization for the implementation.
Sessions / User Metric
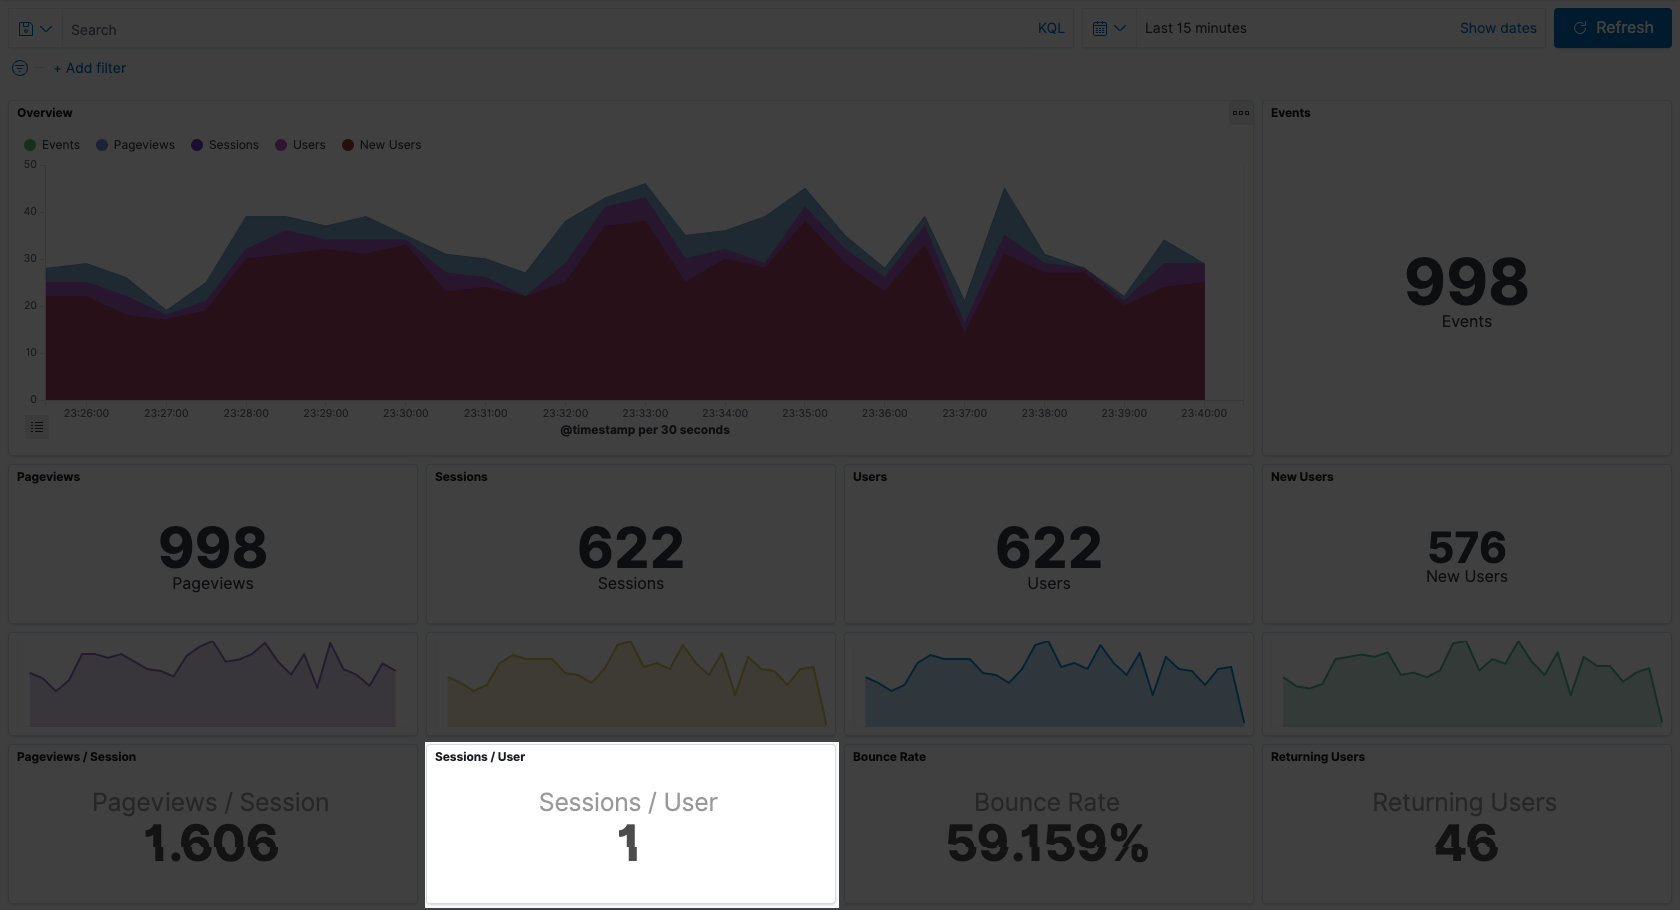
Sessions / User metric is the relation between sessions and users in a time range.
This metric uses Kibana TSVB visualization so query inspection is not supported. Check que visualization for the implementation.
Bounce Rate Metric
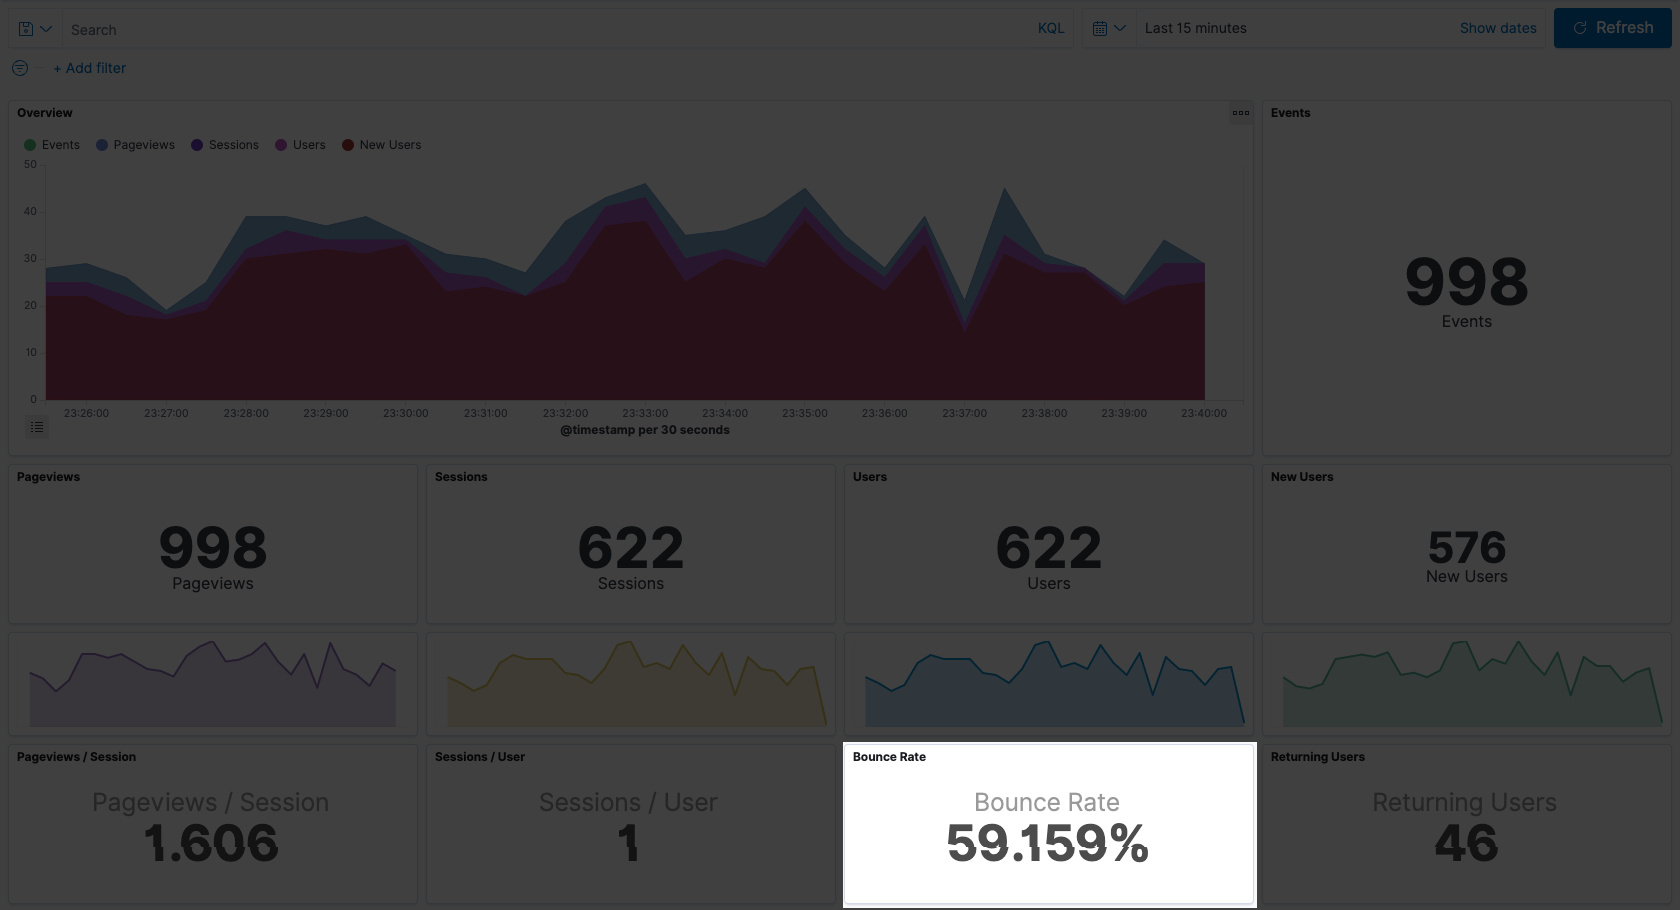
Bounce rate is the number of sessions with only a single pageview event in a time range.
This metric uses Kibana TSVB visualization so query inspection is not supported. Check que visualization for the implementation.
Returning Users Metric
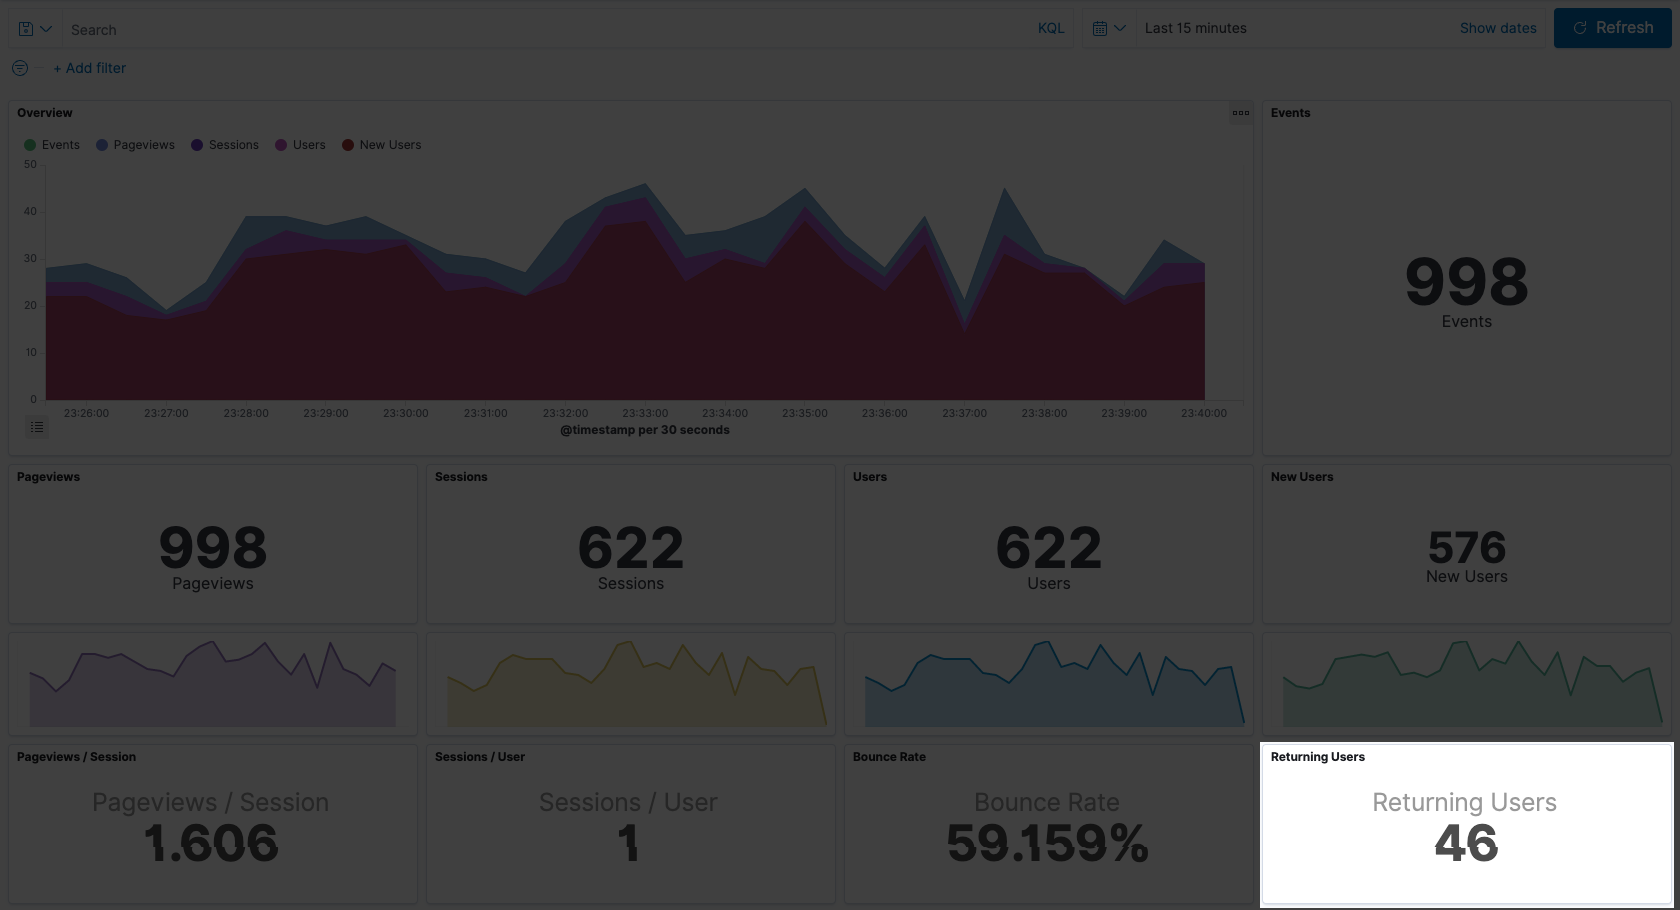
Number of returning users in a time range. It's considered a returning user the total of unique user _ids from not new sessions.
This metric uses Kibana TSVB visualization so query inspection is not supported. Check que visualization for the implementation.
Devices Pie Chart
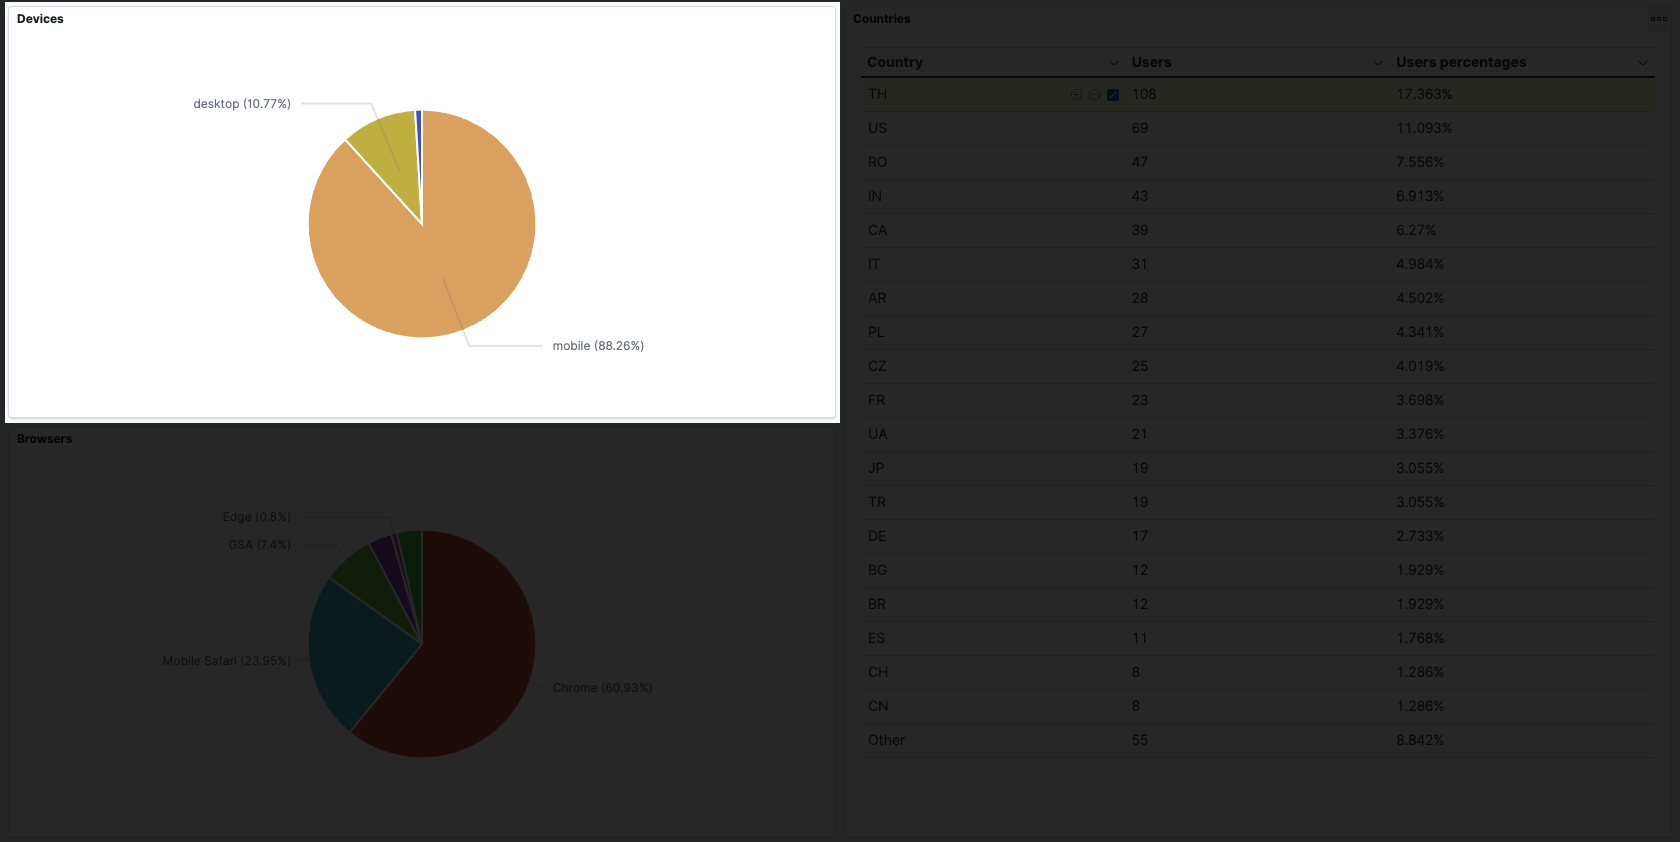
Chart with the count of devices from unique users by type in a time range. Limited by the top 5 devices.
{
  "aggs": {
    "2": {
      "terms": {
        "field": "device.type.keyword",
        "order": {
          "1": "desc"
        },
        "size": 5
      },
      "aggs": {
        "1": {
          "cardinality": {
            "field": "user._id.keyword"
          }
        }
      }
    }
  },
  "size": 0,
  "fields": [
    {
      "field": "@timestamp",
      "format": "date_time"
    }
  ],
  "script_fields": {},
  "stored_fields": [
    "*"
  ],
  "_source": {
    "excludes": []
  },
  "query": {
    "bool": {
      "must": [],
      "filter": [
        {
          "match_all": {}
        },
        {
          "range": {
            "@timestamp": {
              "gte": "2022-05-11T00:22:27.786Z",
              "lte": "2022-05-11T00:37:27.786Z",
              "format": "strict_date_optional_time"
            }
          }
        }
      ],
      "should": [],
      "must_not": []
    }
  }
}
Browsers Pie Chart
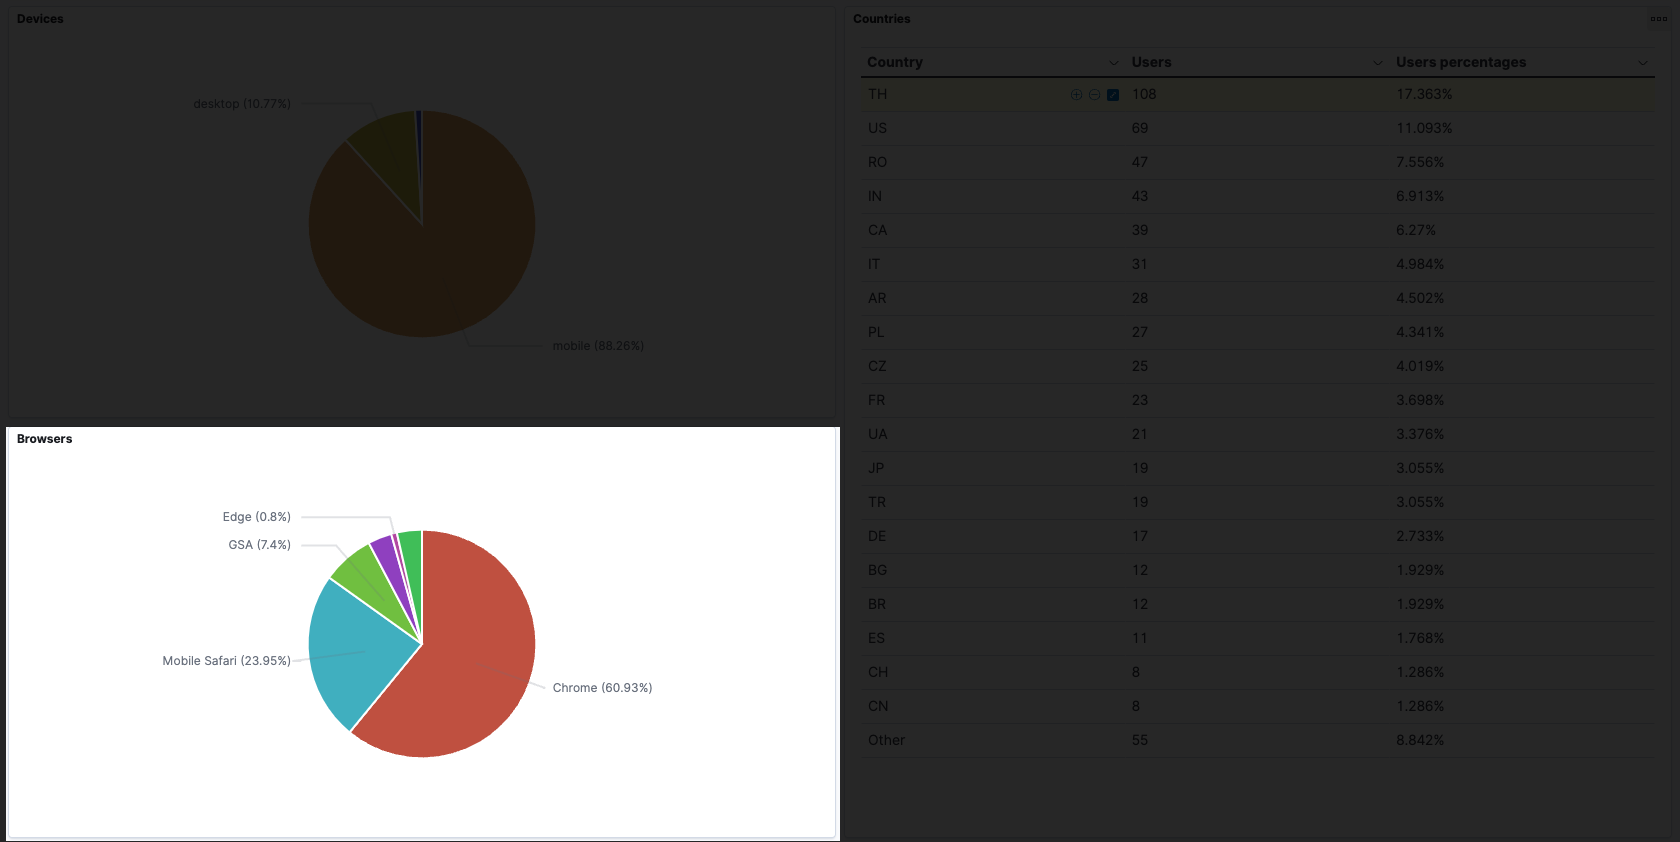
Chart with the count of browsers from unique users by name in a time range. Limited by the top 5 browsers.
{
  "aggs": {
    "2": {
      "terms": {
        "field": "browser.name.keyword",
        "order": {
          "1": "desc"
        },
        "size": 5
      },
      "aggs": {
        "1": {
          "cardinality": {
            "field": "user._id.keyword"
          }
        }
      }
    }
  },
  "size": 0,
  "fields": [
    {
      "field": "@timestamp",
      "format": "date_time"
    }
  ],
  "script_fields": {},
  "stored_fields": [
    "*"
  ],
  "_source": {
    "excludes": []
  },
  "query": {
    "bool": {
      "must": [],
      "filter": [
        {
          "match_all": {}
        },
        {
          "range": {
            "@timestamp": {
              "gte": "2022-05-11T00:25:37.682Z",
              "lte": "2022-05-11T00:40:37.682Z",
              "format": "strict_date_optional_time"
            }
          }
        }
      ],
      "should": [],
      "must_not": []
    }
  }
}
Countries Table
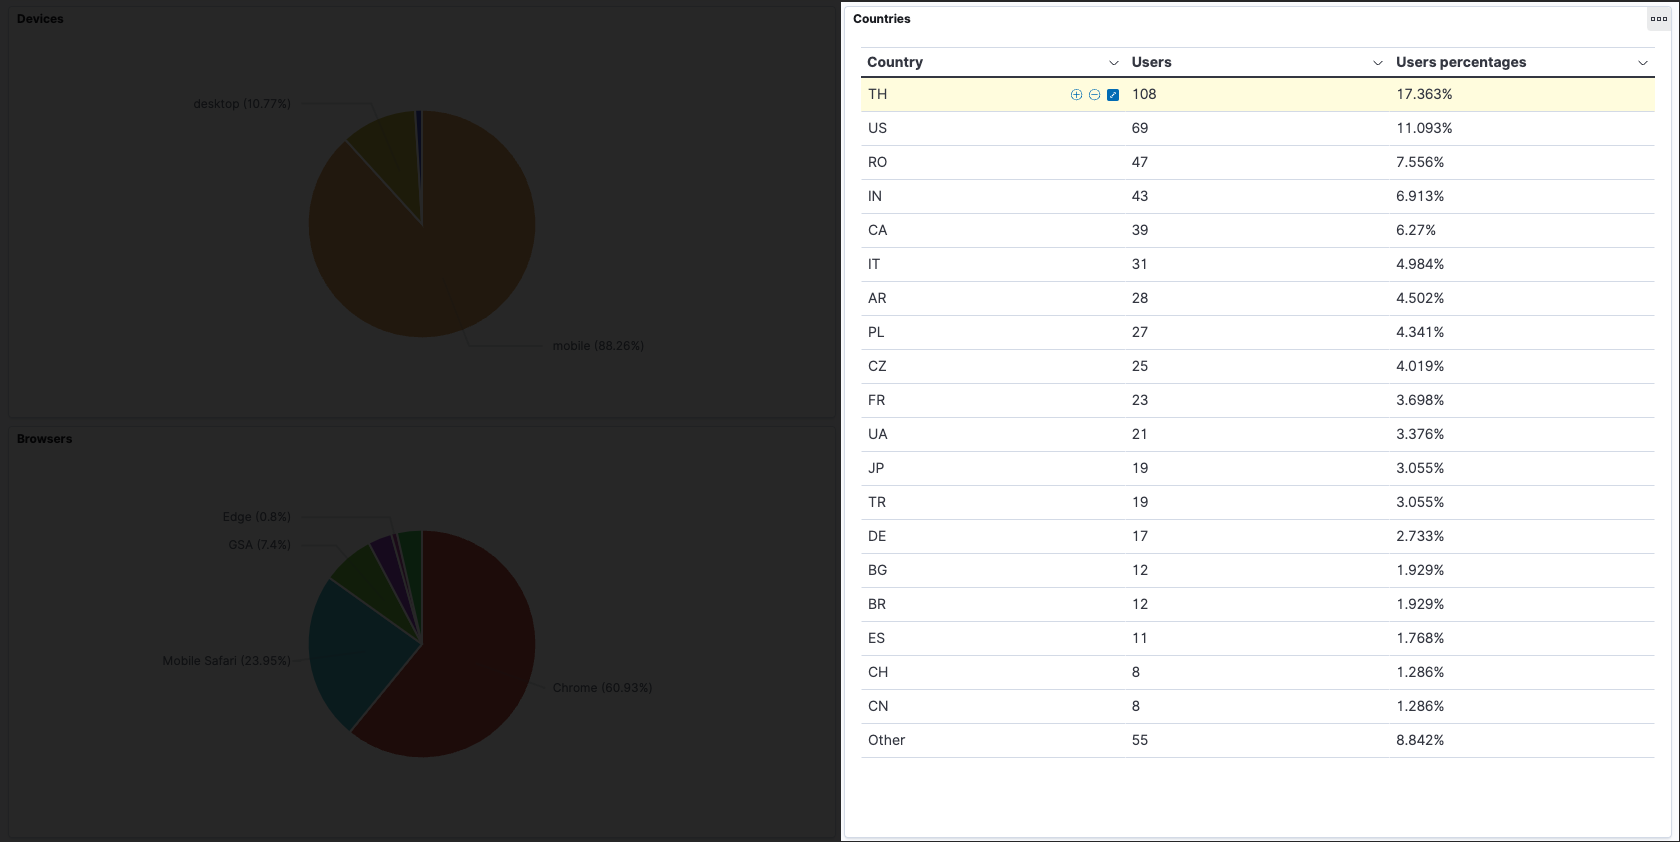
Chart with the count of unique users by country in a time range. Limited by the top 19 countries.
{
  "aggs": {
    "2": {
      "terms": {
        "field": "ip.country.keyword",
        "order": {
          "1": "desc"
        },
        "size": 19
      },
      "aggs": {
        "1": {
          "cardinality": {
            "field": "user._id.keyword"
          }
        }
      }
    }
  },
  "size": 0,
  "fields": [
    {
      "field": "@timestamp",
      "format": "date_time"
    }
  ],
  "script_fields": {},
  "stored_fields": [
    "*"
  ],
  "_source": {
    "excludes": []
  },
  "query": {
    "bool": {
      "must": [],
      "filter": [
        {
          "match_all": {}
        },
        {
          "range": {
            "@timestamp": {
              "gte": "2022-05-11T00:27:38.924Z",
              "lte": "2022-05-11T00:42:38.924Z",
              "format": "strict_date_optional_time"
            }
          }
        }
      ],
      "should": [],
      "must_not": []
    }
  }
}
Overview Map
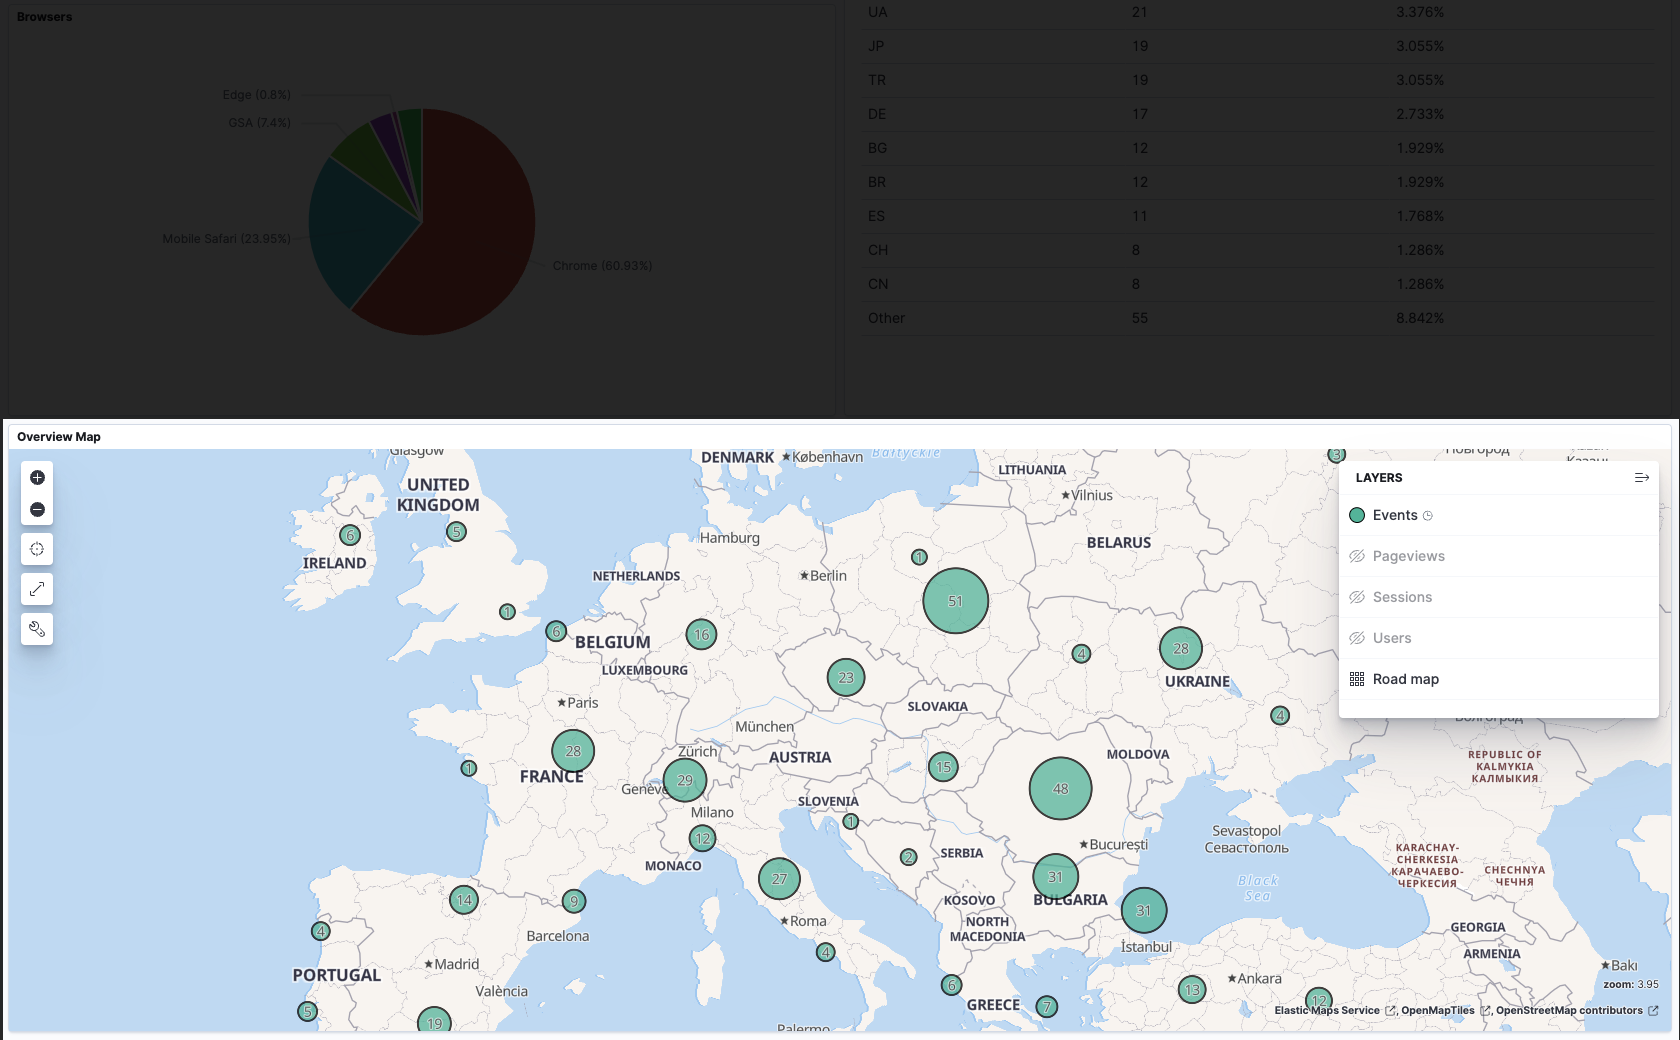
The overview map have values calculated by the same metrics mentioned before (events, pageviews, sessions and users) in a time range.