Your free and open source analytics tool of choice
Take control of your data, visualization and analytics in a simple and intuitive way


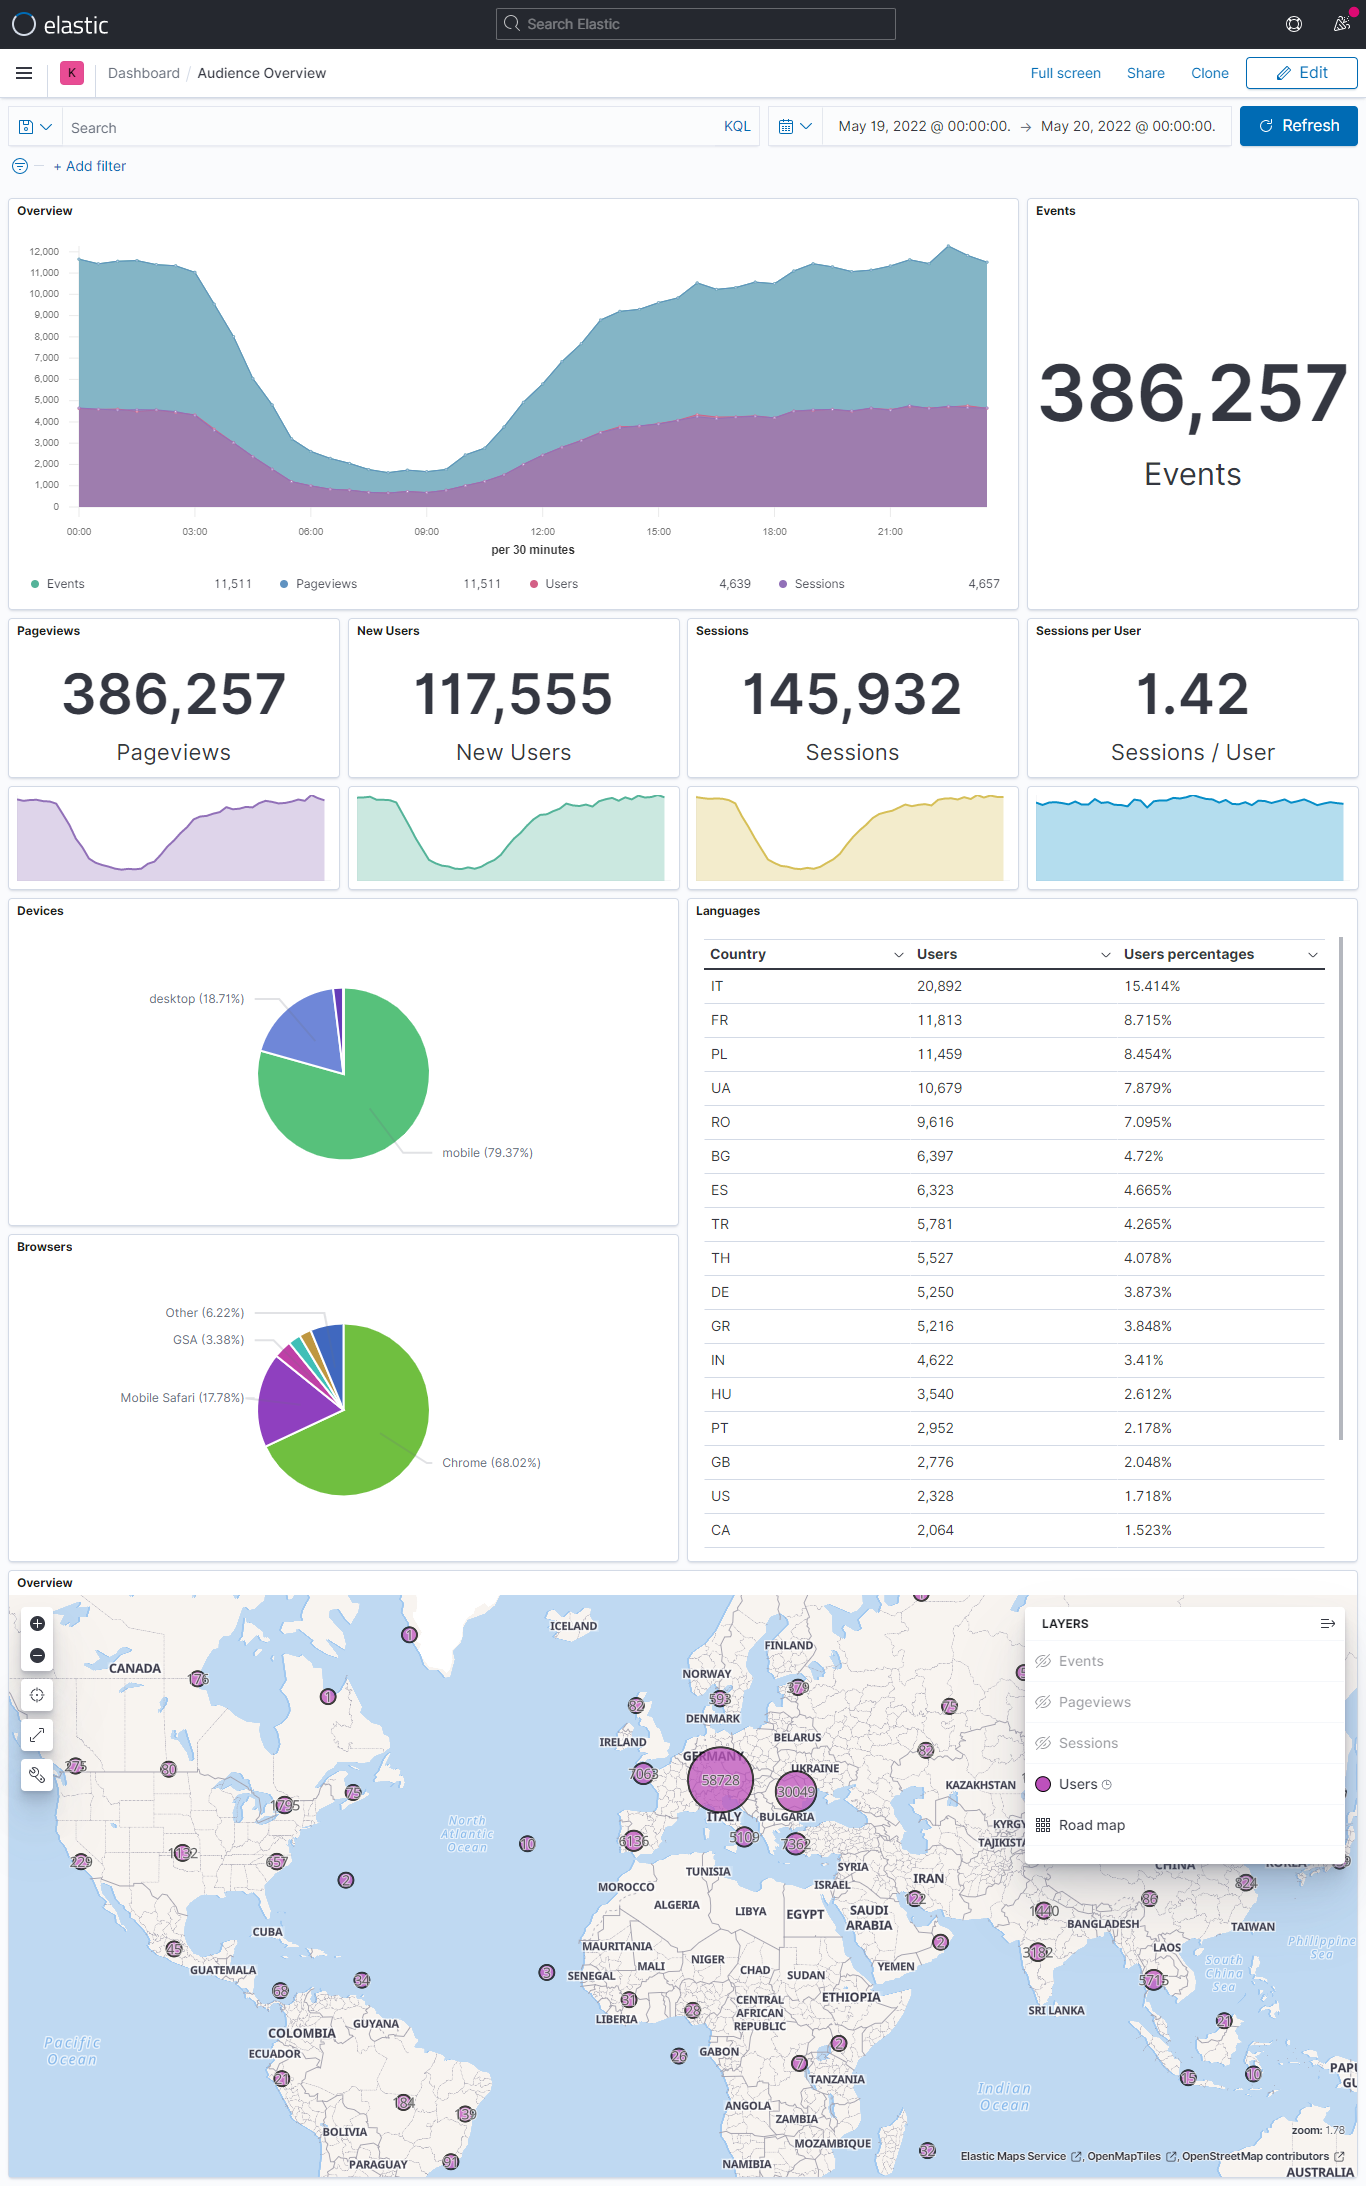
Kibanalytics can assist organizations in determining the top sources of user traffic, assessing the success of their marketing activities and campaigns, tracking goal completions, identifying patterns, identifying trends in user engagement, obtaining other visitor data such as demographics and there’s a lot more you can do.
After looking through a range of both paid and open-source technologies, we found the ELK-stack provided the perfect bundle of features to give organization's the best possible control of their data - both in terms of security and usability
Open to community contributions to ensure everyone has access to effective and intuitive analytics tool
As a self-hosted open-source tool, Kibanalytics gives total control over what and where something is stored, how long it is retained and who can access
We use coding best practices and standards to ensure the effectiveness of data collection without compromising user privacy or experience
Perform complex data analyses with custom aggregation-based visualizations using Kibana dashboards
Allowing boolean operators, wildcards, and field filtering to query a specific subset of events from the selected time frame
Keep and manage large-scale datasets in a way that it can be easily accessed, used and processed by applications and services
Kibanalytics packages everything together into a simple and intuitive analytics tool that gives you control of your data.

Elasticsearch is an open source, distributed, RESTful, JSON-based search engine. Easy to use, scalable and flexible.
Learn more
An open server-side data processing pipeline that ingests data, transforms it, and sends it to your favorite destination.
Learn more
Kibana is a flexible user interface that lets you visualize your Elasticsearch data and navigate the Elastic Stack.
Learn moreKibanalytics uses page tags to collect user data from each website visitor. Each page contains a JavaScript page tag, which runs in the visitor's web browser, gathering data and sending it to the Kibanalytics API server for processing and storing in the database.


By default, Kibanalytics measures the traffic on the website by tracking pageview events. But if you want to track more specific interactions like form submissions, video views, user interactions and any interesting things you can programmatically dispatch custom events that suit your specific needs.
With Kibana powering the visualization of your data, you are freely able to create numerous forms of visualizations from simple tables and graphs through to heat maps and tag clouds. Where something ‘out of the box’ is needed, Vega can be used to create new forms of visualizations.


The group of visitor interactions that happen in a 30-minute window of activity. Average session duration. How long on average each visitor stays on the site.
By using the following code snippet for a test environment:
On Kibanalytics hosting server:
git clone https://github.com/kibanalytics/kibanalytics.git
cd kibanalytics
cp .env.example .env
cp -r .config.example .config
docker-compose --profile local --profile production up -d --build
docker-compose exec node npm run load-dashboards
On pages to be tracked
<!DOCTYPE html>
<html lang="en">
<head>
    <meta charset="UTF-8">
    <title>My Website To Track</title>
    <script src="http://localhost:3000/kbs.js"
            data-server-url="http://localhost:3000/collect">
    </script>
    ...
</head>
<body>
    <h1>My Website Header</h1>
    <main>My Website Main Content</main>
	...
</body>
</html>
Alternatively you can access http://localhost:3000 to interact with example pages.
Open the example dashboard:
http://localhost:5601/app/dashboards.
With the basic steps for a fast production deployment
For further technical explanations you can check here
Browse the open-source codebase, report an issue, or become a contributor.